
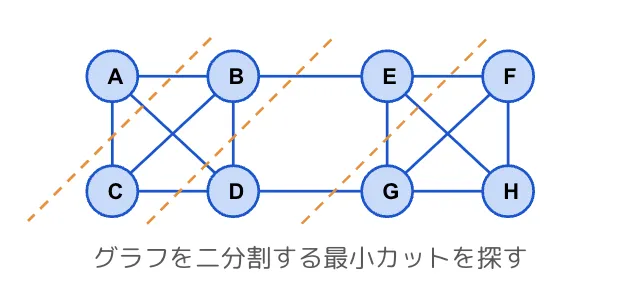
グラフ理論において最小カットとは、1つのグラフを2つのグラフに分割する際に、カットするエッジの重みの合計など何らかのメトリックを最小にしてグラフを分割するための手法です。
Kargerのアルゴリズムは最小カットのうち、以下の特徴を持つグラフに適用できるアルゴリズムです。
- 無向グラフであること
- 重みがないグラフであること
- 末端ノードがないグラフであること
Kargerのアルゴリズムに関する日本語の資料は現時点であまり多くありません(Wikipediaにも日本語翻訳がない)。そこでこの記事では、図を使いながらできるだけわかりやすくKargerのアルゴリズムを解説し、JavaScriptによる実装例を紹介します。
Kargerのアルゴリズムにおける最小カットは、グラフを二分割する際にカットするエッジ数を最小にするカットです。
図のグラフの場合、最小カットはB-E、D-Gの2本のエッジのカットになります。
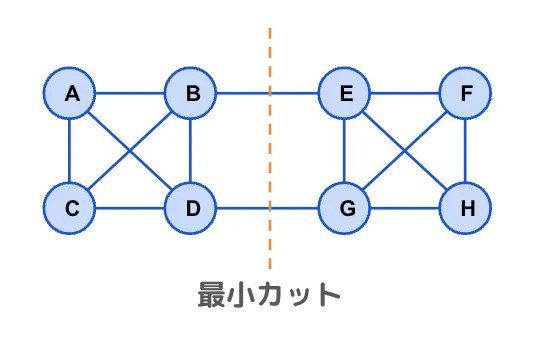
図の例では見ただけで最小カットがわかりますが、複雑なグラフの場合、プログラムでどのように最小カットを求めれば良いでしょうか?
この問題を解決するKargerのアルゴリズムを次に見ていきましょう。
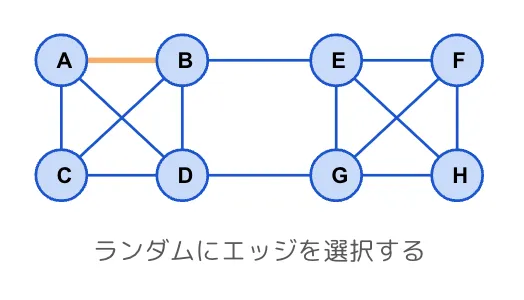
重み付きグラフを扱うStoer-Wagnerアルゴリズムが重みをもとにエッジを選ぶのに対し、重みなしグラフを扱うKargerのアルゴリズムではエッジをランダムに選択します。
このようにランダム要素のあるアルゴリズムをランダム・アルゴリズム(randomized algorithms)、または確率的アルゴリズム(probabilistic algorithms)と言います。
したがって、Kargerのアルゴリズムで正しい解を求めるためにはプロセスを複数回繰り返す必要があることに留意してください。
それではKargerのアルゴリズムのプロセスを見ていきましょう。
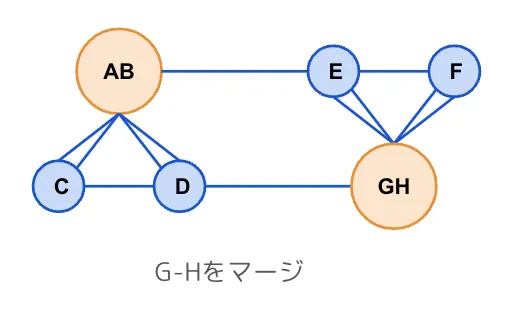
最初に全てのエッジの中からランダムにエッジを選択します。図の例ではA-Bを選択しています。
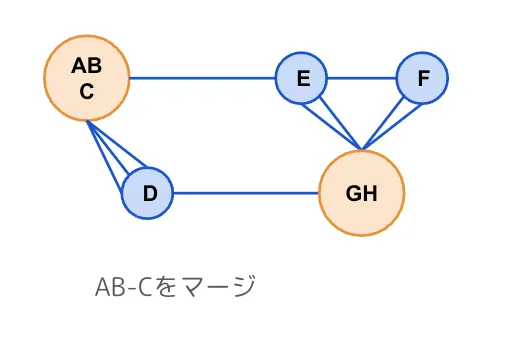
次に選択したエッジの両端のノードをマージします。このとき、選択したエッジはリストから削除します。
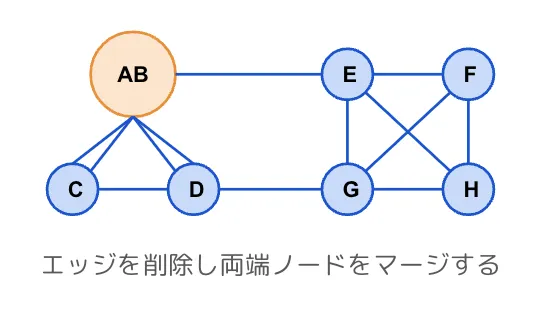
エッジ選択、両端ノードのマージの操作を残りのノードが2個になるまで繰り返していきます。
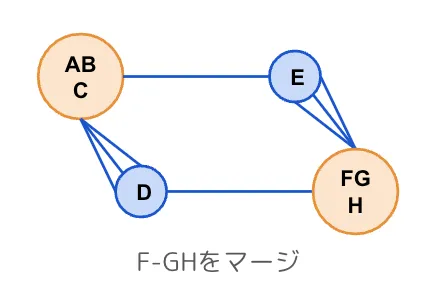
エッジ選択→ノードのマージを繰り返してノード数が3個になりました。
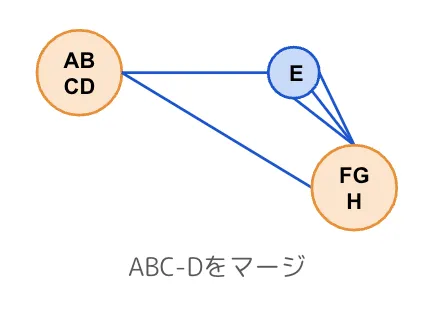
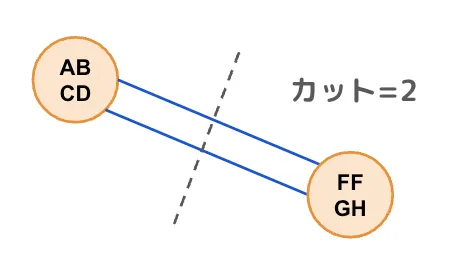
ノードが2個になったら、2個のノードを結ぶエッジの数を数えます。
理想的には下図のようになってほしいですが、ランダムなのでいつもそうなるわけではありません。
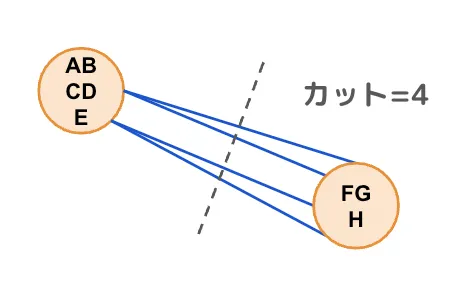
下図のようになってしまうことも考えられます。
ノードが2個になったらエッジ数を記憶しておき、一連のプロセスを何度も繰り返します。十分な繰り返しの後で得られた最小エッジ数が最小カットになります。
下記がKargerのアルゴリズムによるグラフ縮約のJavaScript実装例です。グラフ縮約を十分な回数繰り返すことで最小カットを得ることができます。
// nodes: Node[]
// edges: Edge[]
// Node: { id: number, components: Component[] }
// Edge: [Component, Component]
// Component: string (eg. "A")
const contractGraph = (nodes, edges) => {
  while (nodes.length > 2) {
    const [component1, component2] = edges.splice(getRandomInt(0, edges.length), 1)[0];

    const node1 = nodes.find((node) => node.components.includes(component1));
    const index2 = nodes.findIndex((node) => node.components.includes(component2));
    const node2 = nodes[index2];

    edges = edges.filter(([c1, c2]) => {
      if (node1.components.includes(c1) && node2.components.includes(c2) ||
          node1.components.includes(c2) && node2.components.includes(c1)) {
        return false;
      }
      return true;
    });

    node1.components.push(...nodes[index2].components);
    nodes.splice(index2, 1);
  }
  return [nodes[0], nodes[1], edges];
};
以上です。この記事では、図を使いながらできるだけわかりやすくKargerのアルゴリズムを解説し、JavaScriptによる実装例を紹介しました。
コメントを送る
コメントはブログオーナーのみ閲覧できます